
In the previous articles in this series, we looked at how the starting position of an entry can affect it’s final ranking in a semi final. We found that there is a surprising difference between starting positions in the First Semi-Final and the Second Semi-Final.
As we noted in the previous two articles, there is some truth to the feeling among fans that the second half is the better draw for an entry. Not quite as profound as some would have you believe, but the difference is there.
You can read all the entries in the 2021 Statistics series here
Voting Histories
Another point that comes up often is the notion that some countries tend to award their points to their friends. Or rather we tend to vote for entries that sound like the music we’re used to hearing. This fact comes as a surprise to no one, least of all the EBU. From the allocation draw article on eurovision.tv:
The participants have been allocated into 5 pots, based on historical voting patterns as calculated by the contest’s official televoting partner Digame. Drawing from different pots helps to reduce the chance of so-called neighbourly voting and increases suspense in the Semi-Finals.
Pot allocation explanation from eurovision.tv
The pots and draw for 2021 have been reused from the cancelled Eurovision 2020, which is why they refer to 41 rather than the 39 in the contest this year.
The EBU is basically seeding the semi-final draws to try and combat the trend of friends voting for friends. But that won’t keep us from analyzing the voting histories of the voters in the First Semi-Final!
Numbers, averages and sums
For this part of the series we are looking at point awards. We have looked at the 5 and 10 year average point awards from each eligible voter in the First Semi Final, to each entry in the semi-final. This way we can produce an estimate of how many points, on average, each entry will receive from each voting country, and lastly we can sum up these averages to produce a final point award prediction.
As an example, below is the vote history table for Sweden with all the eligible voters in this year’s First Semi-Final. Blanks in the table denote a year where the voter did not participate in any event with the recipient. For instance: Russia has a blank entry for 2010. Both Russia and Sweden participated that year, but Sweden were in the Second Semi Final, while Russia was in the First Semi Final. Since Sweden did not qualify for the final, Russia had no chances to vote for Sweden, and therefore the entry is blank. (0 points awarded in 0 events)
| Country | 2019 | 2018 | 2017 | 2016 | 2015 | 2014 | 2013 | 2012 | 2011 | 2010 | Avg. 10 | Avg. 5 |
|---|---|---|---|---|---|---|---|---|---|---|---|---|
| Lithuania | 6,50 | 6,00 | 4,50 | 3,50 | 10,00 | 7,00 | 0,00 | 10,00 | 0,00 | 3,00 | 5,05 | 6,10 |
| Slovenia | 3,50 | 6,50 | 4,75 | 2,50 | 12,00 | 8,00 | 6,00 | 10,00 | 4,50 | 0,00 | 5,78 | 5,85 |
| Russia | 0,50 | 6,00 | 1,00 | 8,00 | 4,00 | 0,00 | 12,00 | 1,00 | 4,06 | 3,88 | ||
| Australia | 10,00 | 8,00 | 7,00 | 0,00 | 12,00 | 7,40 | 7,40 | |||||
| North Macedonia | 1,25 | 3,50 | 3,00 | 0,00 | 5,00 | 0,00 | 0,00 | 7,00 | 4,00 | 2,64 | 2,55 | |
| Ireland | 7,75 | 0,00 | 3,00 | 3,50 | 10,00 | 4,00 | 5,00 | 12,00 | 6,00 | 5,00 | 5,63 | 4,85 |
| Cyprus | 3,50 | 6,00 | 6,00 | 0,50 | 11,00 | 0,00 | 10,00 | 11,00 | 1,00 | 5,44 | 5,40 | |
| Norway | 10,50 | 8,75 | 5,50 | 3,50 | 12,00 | 8,00 | 12,00 | 12,00 | 10,00 | 12,00 | 9,43 | 8,05 |
| Croatia | 3,25 | 0,00 | 3,00 | 3,50 | 1,00 | 6,50 | 4,00 | 2,00 | 2,91 | 2,44 | ||
| Belgium | 1,00 | 4,00 | 7,75 | 0,50 | 12,00 | 9,00 | 1,00 | 12,00 | 8,00 | 6,14 | 5,05 | |
| Israel | 3,00 | 5,00 | 6,50 | 0,00 | 11,00 | 10,00 | 0,00 | 12,00 | 12,00 | 0,00 | 5,95 | 5,10 |
| Romania | 1,50 | 0,50 | 4,50 | 8,00 | 12,00 | 0,00 | 10,00 | 5,00 | 1,00 | 4,72 | 3,63 | |
| Azerbaijan | 0,75 | 1,00 | 2,25 | 0,00 | 5,00 | 0,00 | 0,00 | 7,00 | 3,00 | 2,00 | 2,10 | 1,80 |
| Malta | 7,00 | 6,00 | 3,50 | 0,00 | 11,00 | 7,00 | 0,00 | 7,00 | 6,00 | 5,28 | 5,50 | |
| Italy | 0,50 | 1,75 | 5,25 | 1,00 | 11,00 | 0,00 | 0,00 | 0,00 | 1,50 | 2,33 | 3,90 | |
| Germany | 3,75 | 6,00 | 2,00 | 9,00 | 11,00 | 0,00 | 3,00 | 12,00 | 0,50 | 5,25 | 6,35 | |
| The Netherlands | 10,50 | 6,50 | 5,00 | 6,00 | 10,00 | 8,00 | 3,00 | 12,00 | 11,00 | 6,00 | 7,80 | 7,60 |
| Ukraine | 4,25 | 3,50 | 2,50 | 11,00 | 0,00 | 6,50 | 3,00 | 0,00 | 3,84 | 3,42 |
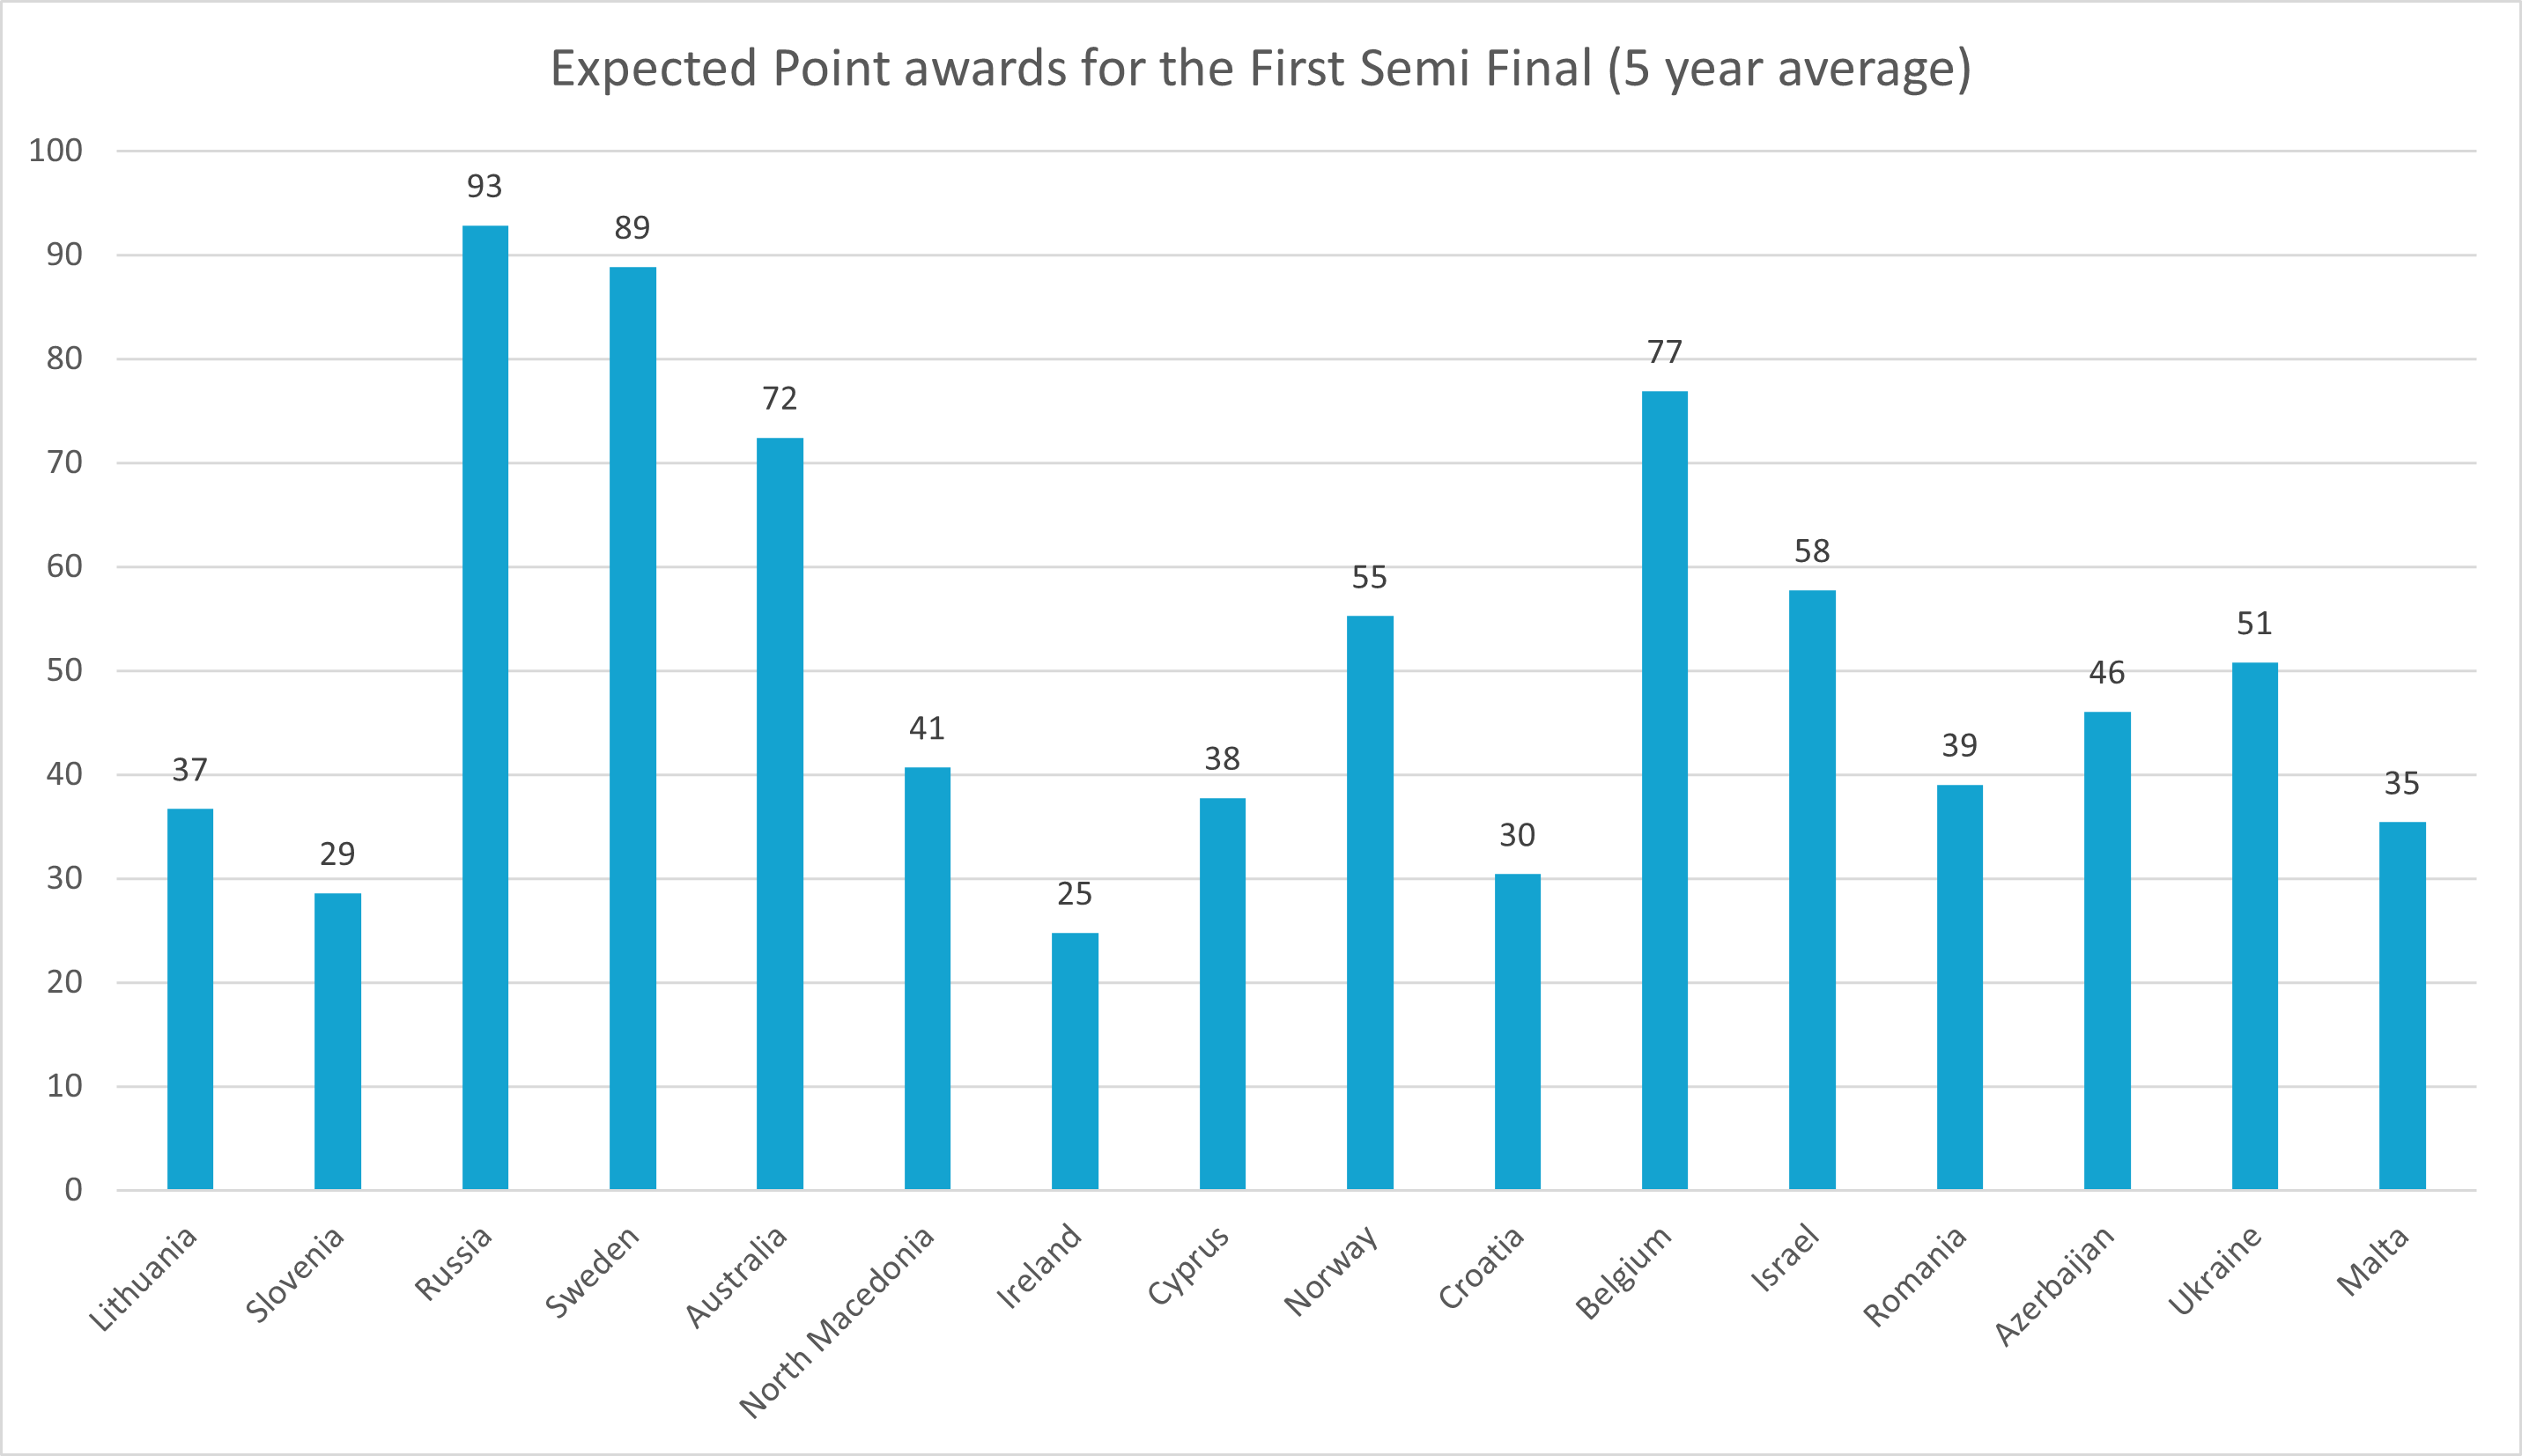
With a whole bunch of tables just like the one for Sweden, we can create a chart of expected point sums for the First Semi-Final.
Predicted Qualifiers
With all the math done and charts drawn, we can use the 5 year window to try and predict the qualifiers for the First Semi-Final:
| Country | Expected Points |
|---|---|
| Russia | 93 |
| Sweden | 89 |
| Belgium | 77 |
| Australia | 72 |
| Israel | 58 |
| Norway | 55 |
| Ukraine | 51 |
| Azerbaijan | 46 |
| North Macedonia | 41 |
| Romania | 39 |
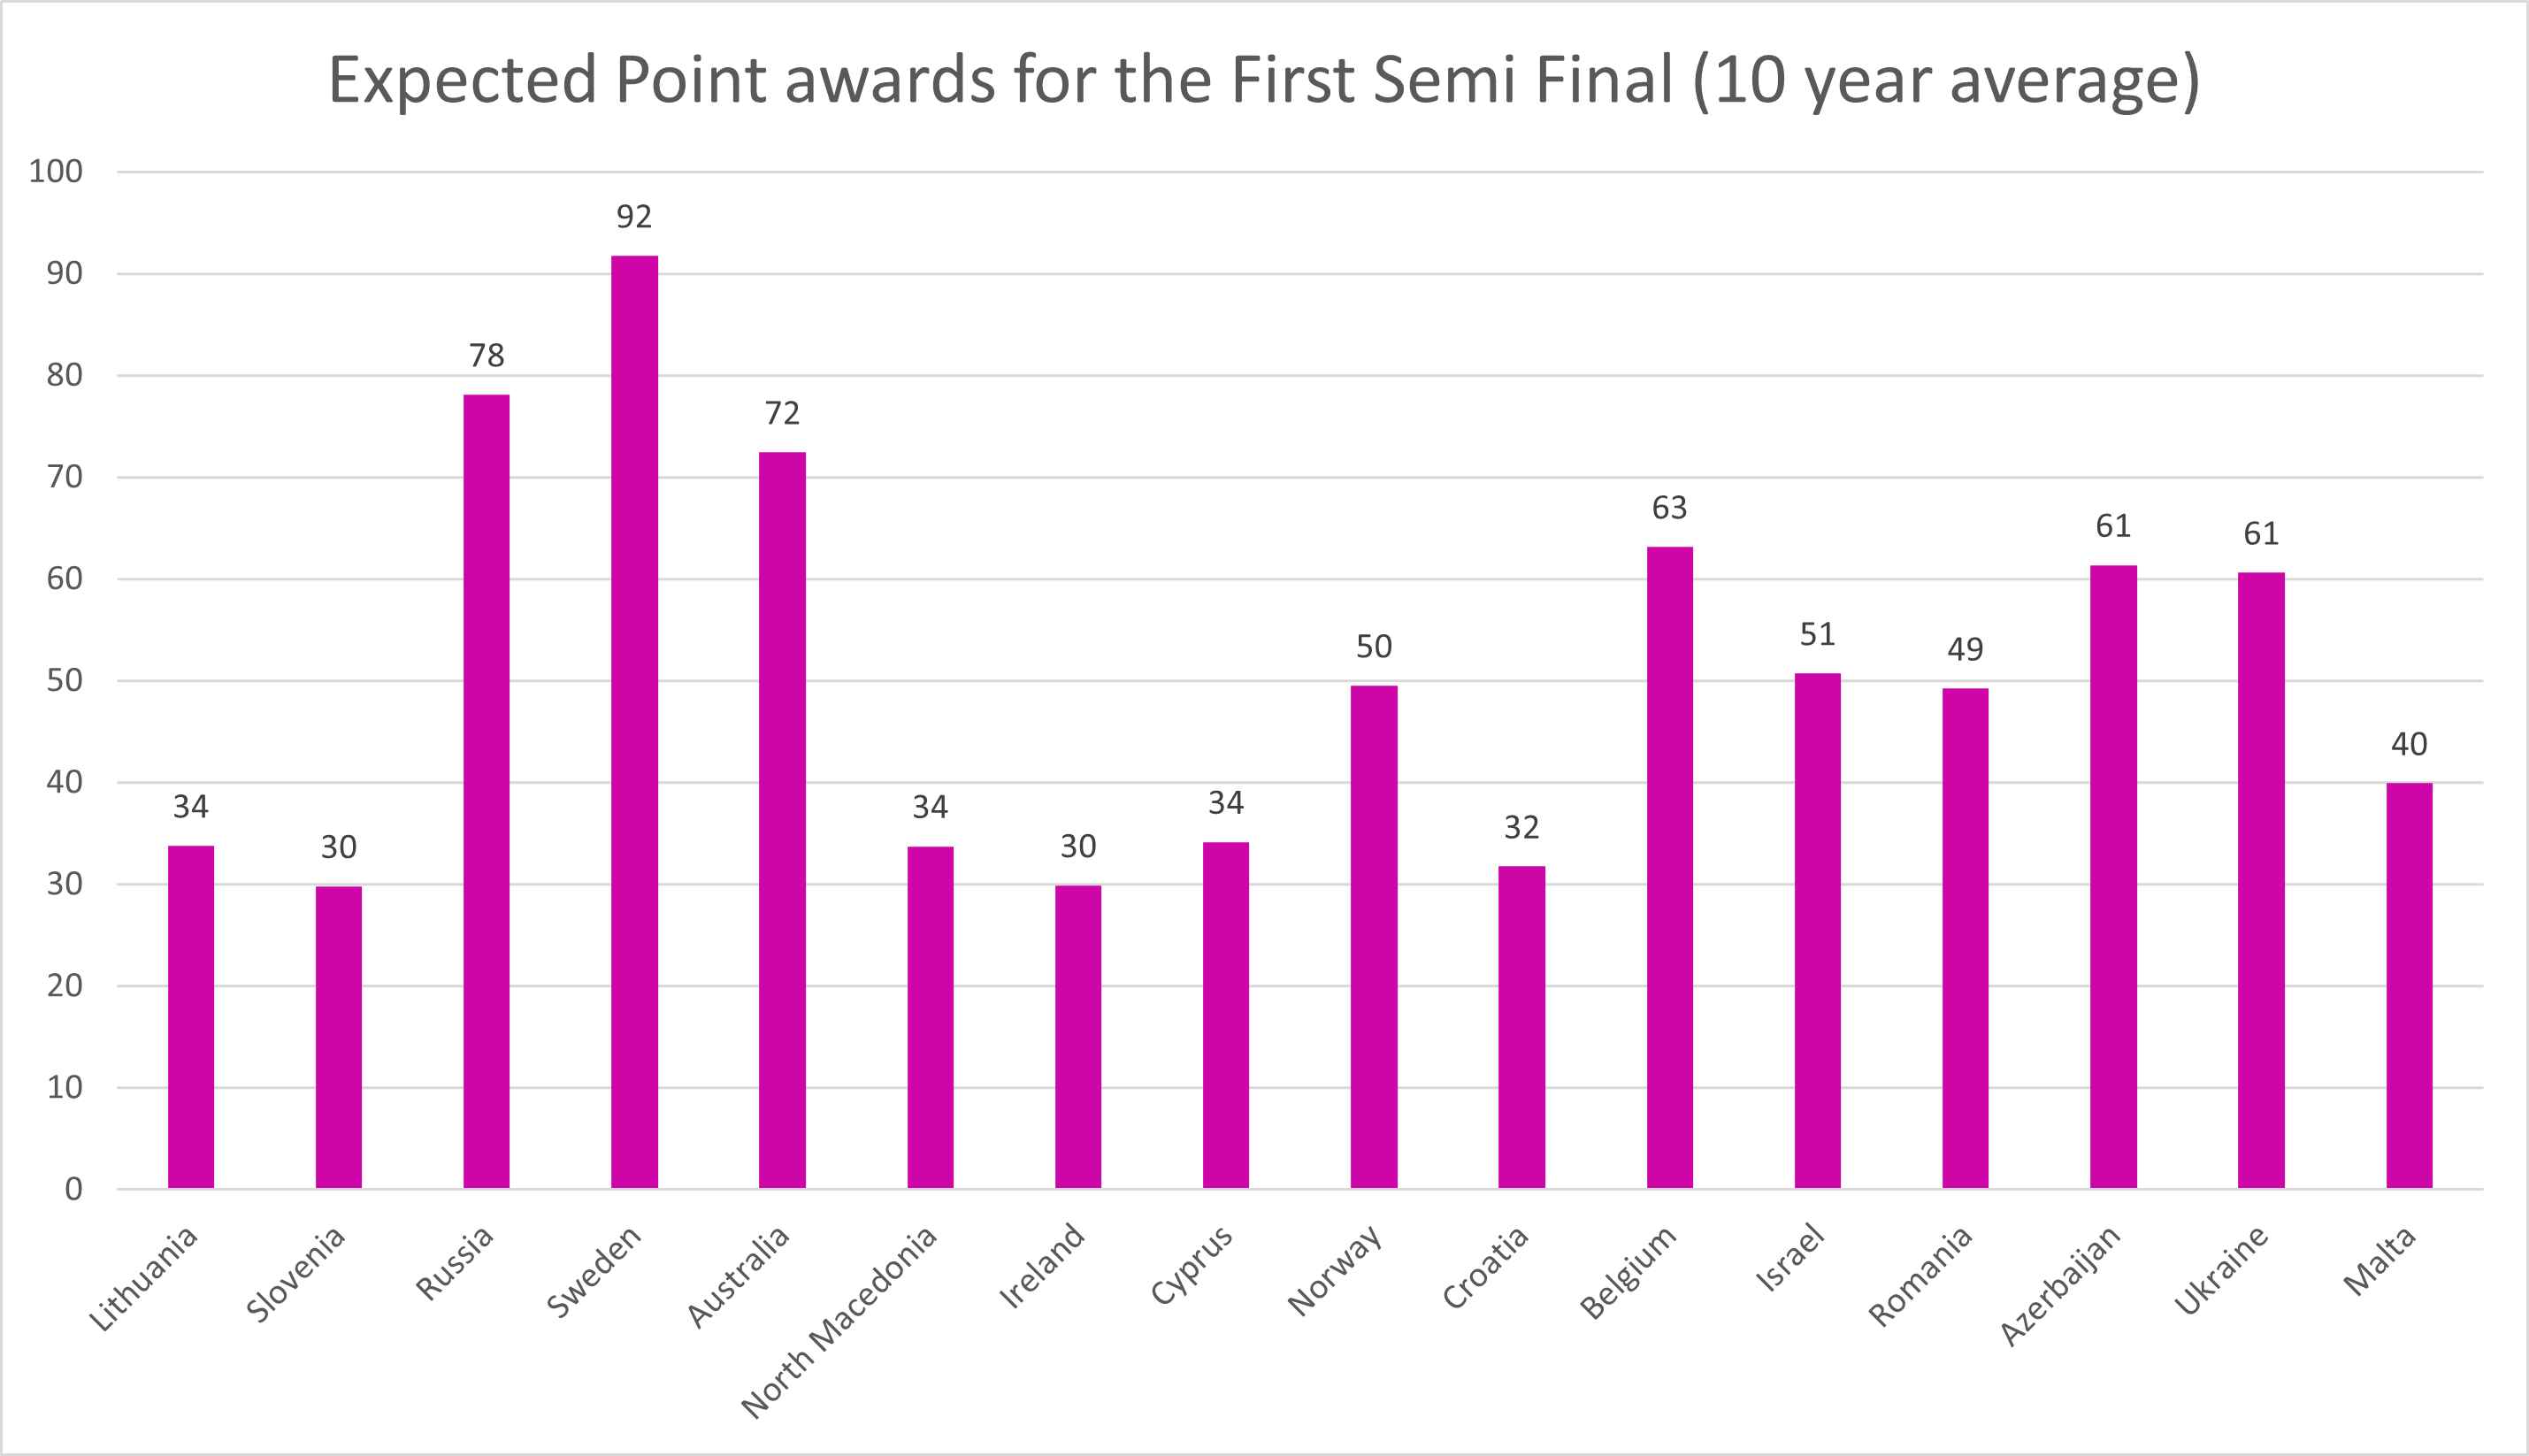
And the predicted qualifiers for the 10 year window are:
| Country | Expected Points |
|---|---|
| Sweden | 92 |
| Russia | 78 |
| Australia | 72 |
| Belgium | 63 |
| Azerbaijan | 61 |
| Ukraine | 61 |
| Israel | 51 |
| Norway | 50 |
| Romania | 49 |
| Malta | 40 |
In the 5 year average table, Cyprus misses out on qualification by a single point, while in the 10 year average Malta squeezes in front of Cyprus by a 6 point margin.
| Country | R/O | Average 5 years | Average 10 years |
|---|---|---|---|
 | 1 | 0 | 0 |
 | 2 | 0 | 0 |
 | 3 | 0 | 0 |
 | 4 | 0 | 0 |
 | 5 | 0 | 0 |
 | 6 | 0 | 0 |
 | 7 | 0 | 0 |
 | 8 | 0 | 0 |
 | 9 | 0 | 0 |
 | 10 | 0 | 0 |
 | 11 | 0 | 0 |
 | 12 | 0 | 0 |
 | 13 | 0 | 0 |
 | 14 | 0 | 0 |
 | 15 | 0 | 0 |
 | 16 | 0 | 0 |
| These countries may vote |
|---|
                   |
Suggested reading:
Semi Final 1 Running Order – Analysis and Qualifiers


")
")
")
")
")