
Last week we looked at how the starting position of an entry can affect it’s final ranking in a semi-final. We found that there is a surprising difference between starting positions in the First Semi-Final and the Second Semi-Final.
As we noted in the previous two articles, there is some truth to the feeling among fans that the second half is the better draw for an entry. Not quite as profound as some would have you believe, but the difference is there.
You can read all the entries in the 2021 Statistics series here
Voting Histories
Another point that comes up often is the notion that some countries tend to award their points to their friends. Or rather we tend to vote for entries that sound like the music we’re used to hearing. This fact comes as a surprise to no one, least of all the EBU. From the allocation draw article on eurovision.tv:
The participants have been allocated into 5 pots, based on historical voting patterns as calculated by the contest’s official televoting partner Digame. Drawing from different pots helps to reduce the chance of so-called neighbourly voting and increases suspense in the Semi-Finals.
Pot allocation explanation from eurovision.tv
The pots and draw for 2021 have been reused from the cancelled Eurovision 2020, which is why they refer to 41 rather than the 39 in the contest this year.
The EBU is basically seeding the semi final draws to try and combat the trend of friends voting for friends. But that won’t keep us from analyzing the voting histories of the voters in semi final 1!
Numbers, averages and sums
For this part of the series we are looking at point awards. We have looked at the 5 and 10 year average point awards from each eligible voter in the First Semi-Final, to each entry in the semi-final. This way we can produce an estimate of how many points, on average, each entry will receive from each voting country, and lastly we can sum up these averages to produce a final point award prediction.
As an example, below is the vote history table for Denmark with all the eligible voters in this year’s Second Semi-Final. Blanks in the table denote a year where the voter did not participate in any event with the recipient. For instance: Czech Republic has blank entries in the table for all years except the last 3. The years 2010 to 2014 Czech Republic did not participate. In 2015 they competed in the Second Semi-Final while Denmark competed in the First Semi-Final. Neither country qualified. In 2016 Czech Republic made i to the Grand Final from the First Semi-Final, while Denmark failed to qualify from the Second Semi-Final. Both the years 2015 and 2016 afforded Czech Republic 0 chances to vote for Denmark, thus leaving blanks in the table.
In another example, France has a 0 entry in 2015. They were eligible to vote in the First Semi-Final that year, but awarded Denmark no points.
| Country | 2019 | 2018 | 2017 | 2016 | 2015 | 2014 | 2013 | 2012 | 2011 | 2010 | Avg. 10 | Avg. 5 |
|---|---|---|---|---|---|---|---|---|---|---|---|---|
| San Marino | 0,00 | 4,50 | 1,25 | 1,00 | 0,00 | 2,00 | 4,00 | 1,82 | 1,92 | |||
| Estonia | 4,00 | 4,00 | 3,25 | 7,00 | 0,00 | 10,00 | 2,00 | 10,00 | 5,00 | 5,03 | 4,56 | |
| Czech Republic | 0,00 | 3,50 | 3,00 | 2,17 | 2,17 | |||||||
| Greece | 0,00 | 0,00 | 0,00 | 1,00 | 0,00 | 7,00 | 0,50 | 0,00 | 0,00 | 0,94 | 0,25 | |
| Austria | 1,50 | 2,50 | 0,00 | 1,00 | 0,00 | 8,50 | 0,00 | 3,50 | 2,13 | 1,25 | ||
| Poland | 2,50 | 3,50 | 0,00 | 0,50 | 6,00 | 3,00 | 12,00 | 3,93 | 1,63 | |||
| Moldova | 1,25 | 1,25 | 0,00 | 0,00 | 0,00 | 6,50 | 0,00 | 1,00 | 0,00 | 1,11 | 0,63 | |
| Iceland | 2,00 | 6,00 | 1,50 | 8,00 | 12,00 | 6,50 | 12,00 | 12,00 | 7,50 | 3,17 | ||
| Serbia | 1,00 | 3,25 | 1,00 | 0,00 | 0,00 | 10,00 | 0,00 | 0,00 | 0,00 | 1,69 | 1,05 | |
| Georgia | 3,50 | 1,50 | 0,00 | 2,00 | 0,00 | 0,00 | 7,00 | 0,00 | 0,00 | 1,50 | 1,55 | 1,40 |
| Albania | 0,25 | 0,00 | 0,00 | 2,50 | 0,00 | 0,00 | 1,00 | 0,00 | 0,00 | 2,00 | 0,58 | 0,55 |
| Portugal | 0,50 | 1,00 | 0,00 | 5,00 | 0,00 | 0,00 | 4,00 | 1,50 | 0,50 | |||
| Finland | 0,00 | 6,50 | 2,00 | 1,00 | 6,00 | 7,00 | 6,50 | 0,00 | 2,00 | 3,44 | 2,38 | |
| Latvia | 4,75 | 3,00 | 0,00 | 1,00 | 0,00 | 6,00 | 4,00 | 9,00 | 10,00 | 4,19 | 2,19 | |
| Switzerland | 1,25 | 1,00 | 0,75 | 0,50 | 3,00 | 3,00 | 5,00 | 0,00 | 2,50 | 1,89 | 0,88 | |
| France | 2,50 | 1,75 | 0,50 | 0,00 | 3,00 | 12,00 | 0,00 | 4,50 | 0,00 | 2,69 | 1,19 | |
| United Kingdom | 3,75 | 1,00 | 1,00 | 0,00 | 3,00 | 12,00 | 0,00 | 5,00 | 3,00 | 3,19 | 1,44 | |
| Spain | 0,00 | 0,00 | 0,00 | 1,00 | 3,00 | 8,00 | 0,00 | 0,00 | 4,00 | 1,78 | 0,25 | |
| Bulgaria | 0,00 | 1,00 | 0,00 | 2,00 | 0,00 | 9,50 | 1,00 | 1,93 | 0,33 |
Like we did for the First Semi-Final, we can now compile two charts showing the expected score for each participant, for the 5 year and 10 year windows respectively.
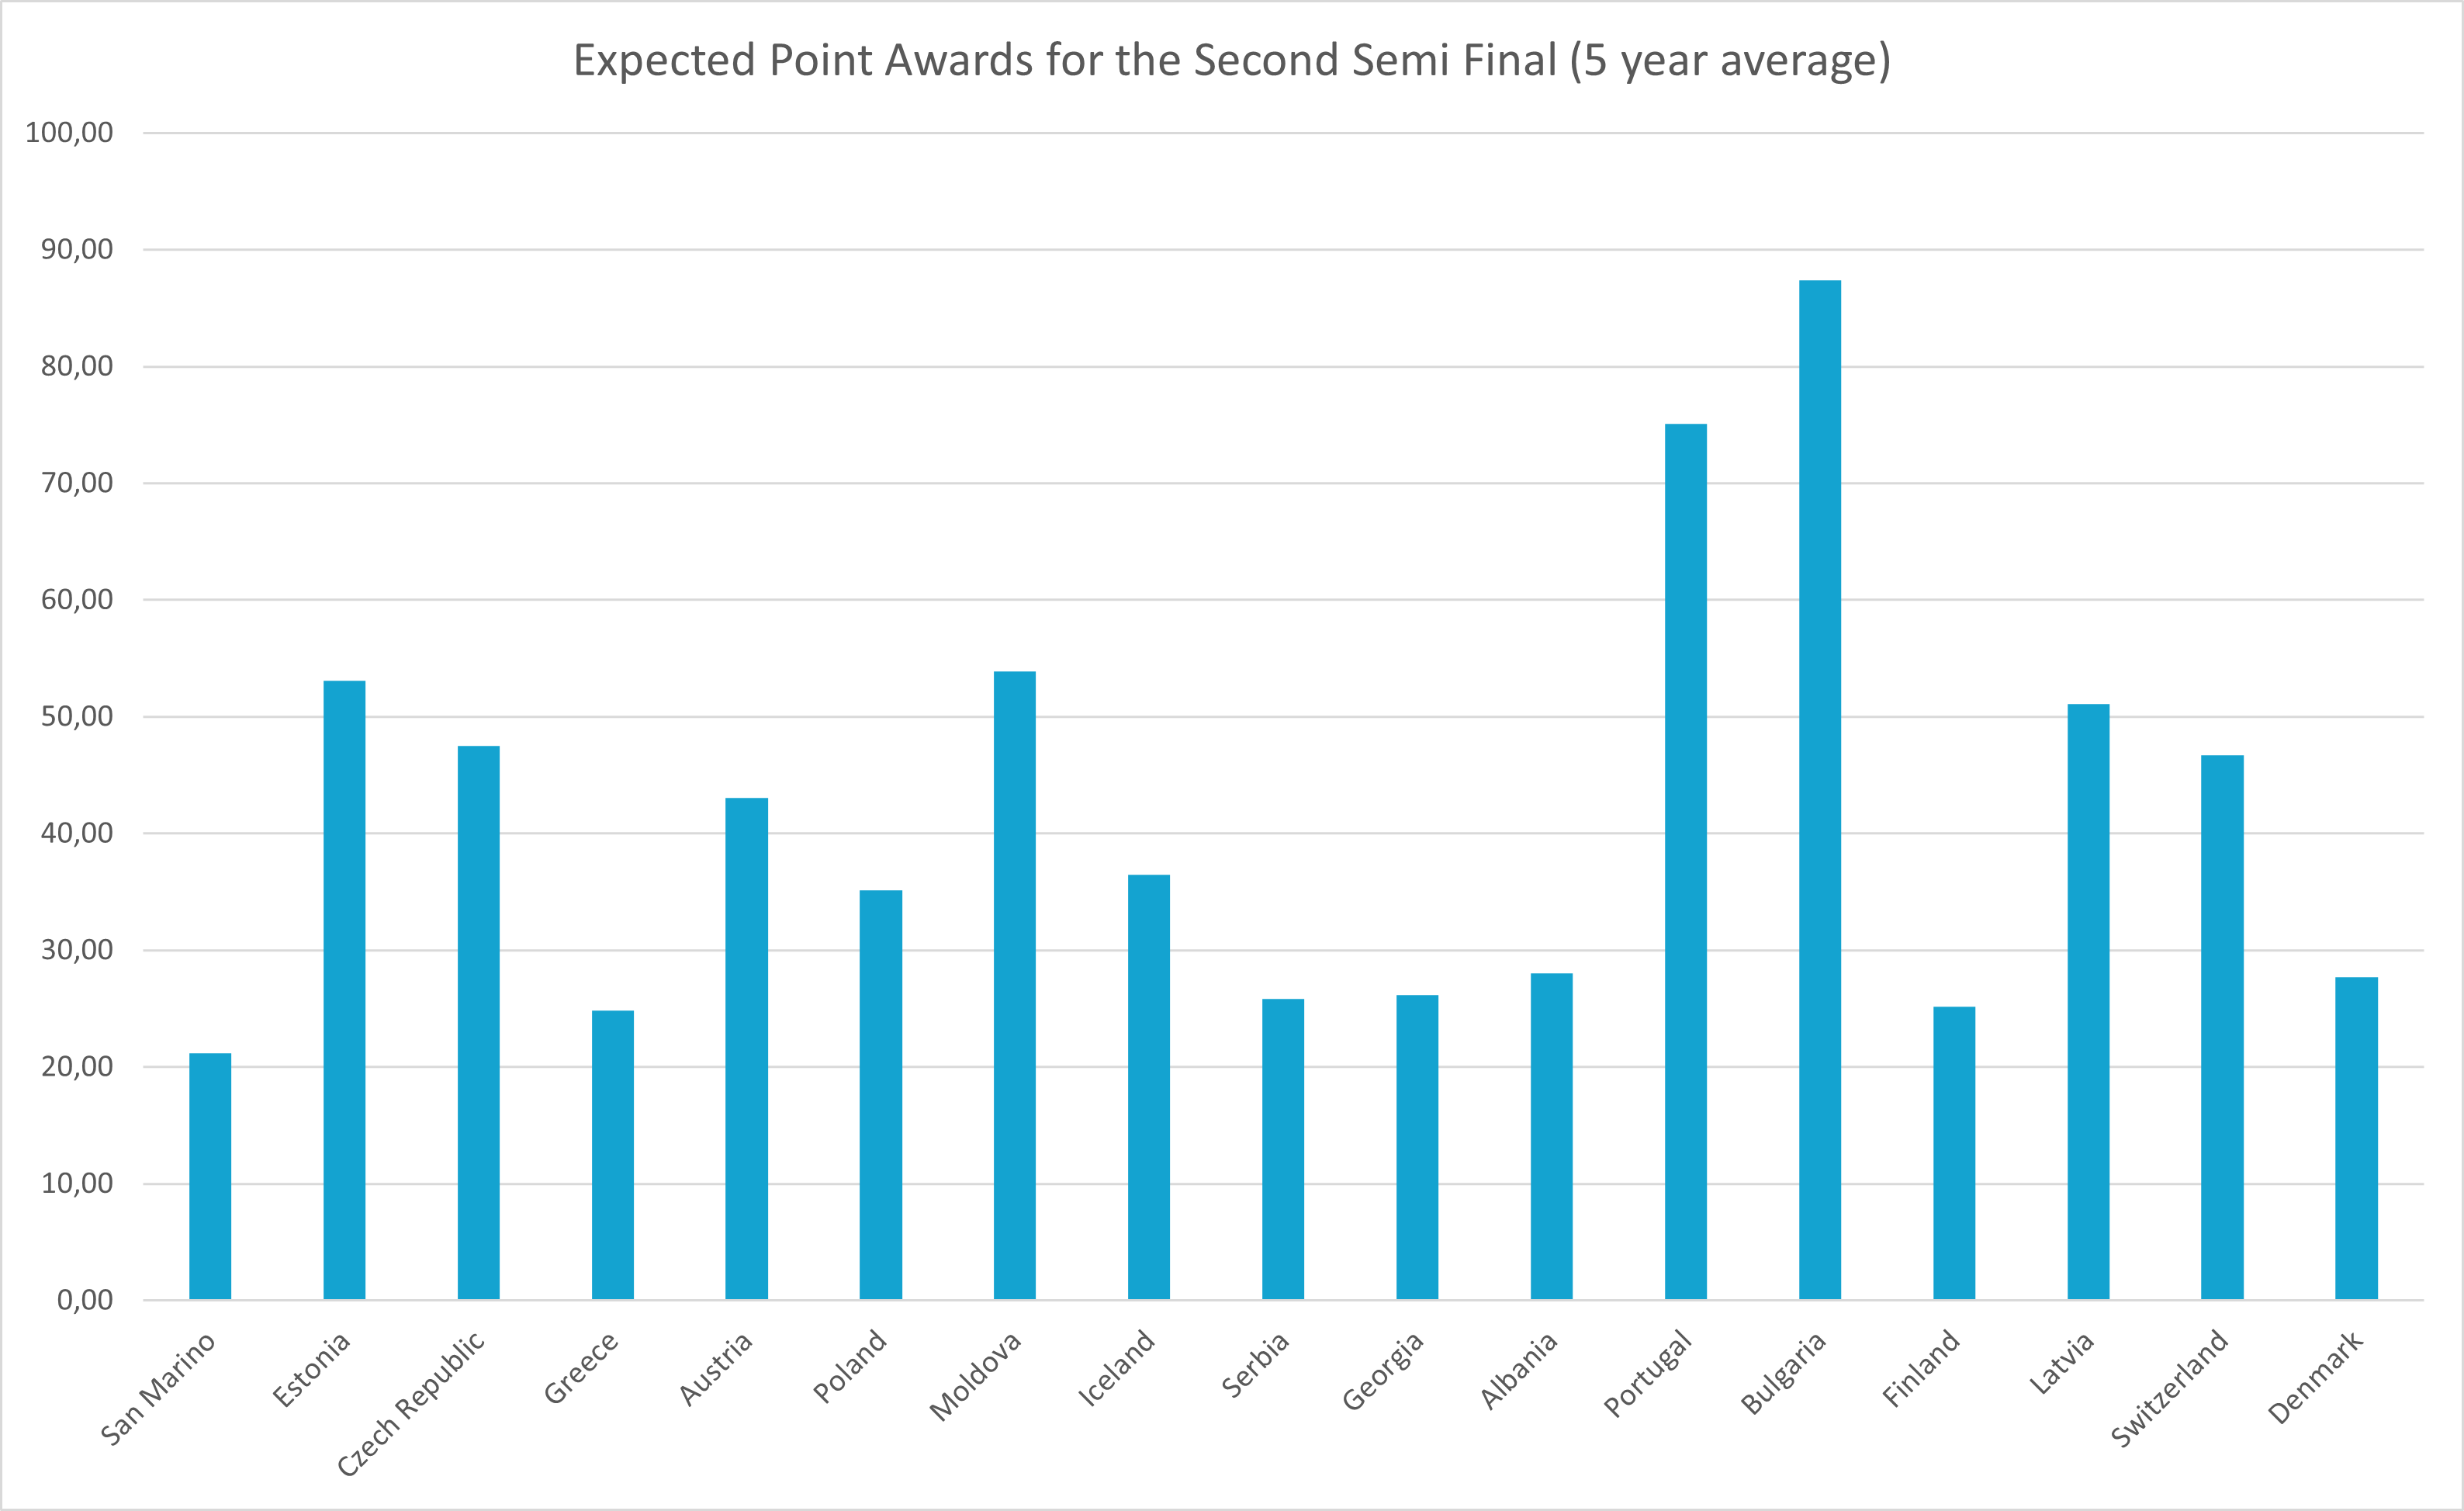
The 5 year window predicts the folloing qualifiers for semi final 2:
| Country | Expected Points |
|---|---|
| Bulgaria | 87.4 |
| Portugal | 75.1 |
| Moldova | 53.9 |
| Estonia | 53.1 |
| Latvia | 51.1 |
| Czech Republic | 47.5 |
| Switzerland | 46.7 |
| Austria | 43.0 |
| Iceland | 36.5 |
| Poland | 35.1 |
Bulgaria in takes the number 1 spot with a significant margin down to the runner up, Portugal. This is interesting, given that Portugal has a Eurovision Victory in it’s recent 5 year window, while Bulgaria has never won. Denmark misses qualification and ends at a mere 12th place in the Second Semi-Final.
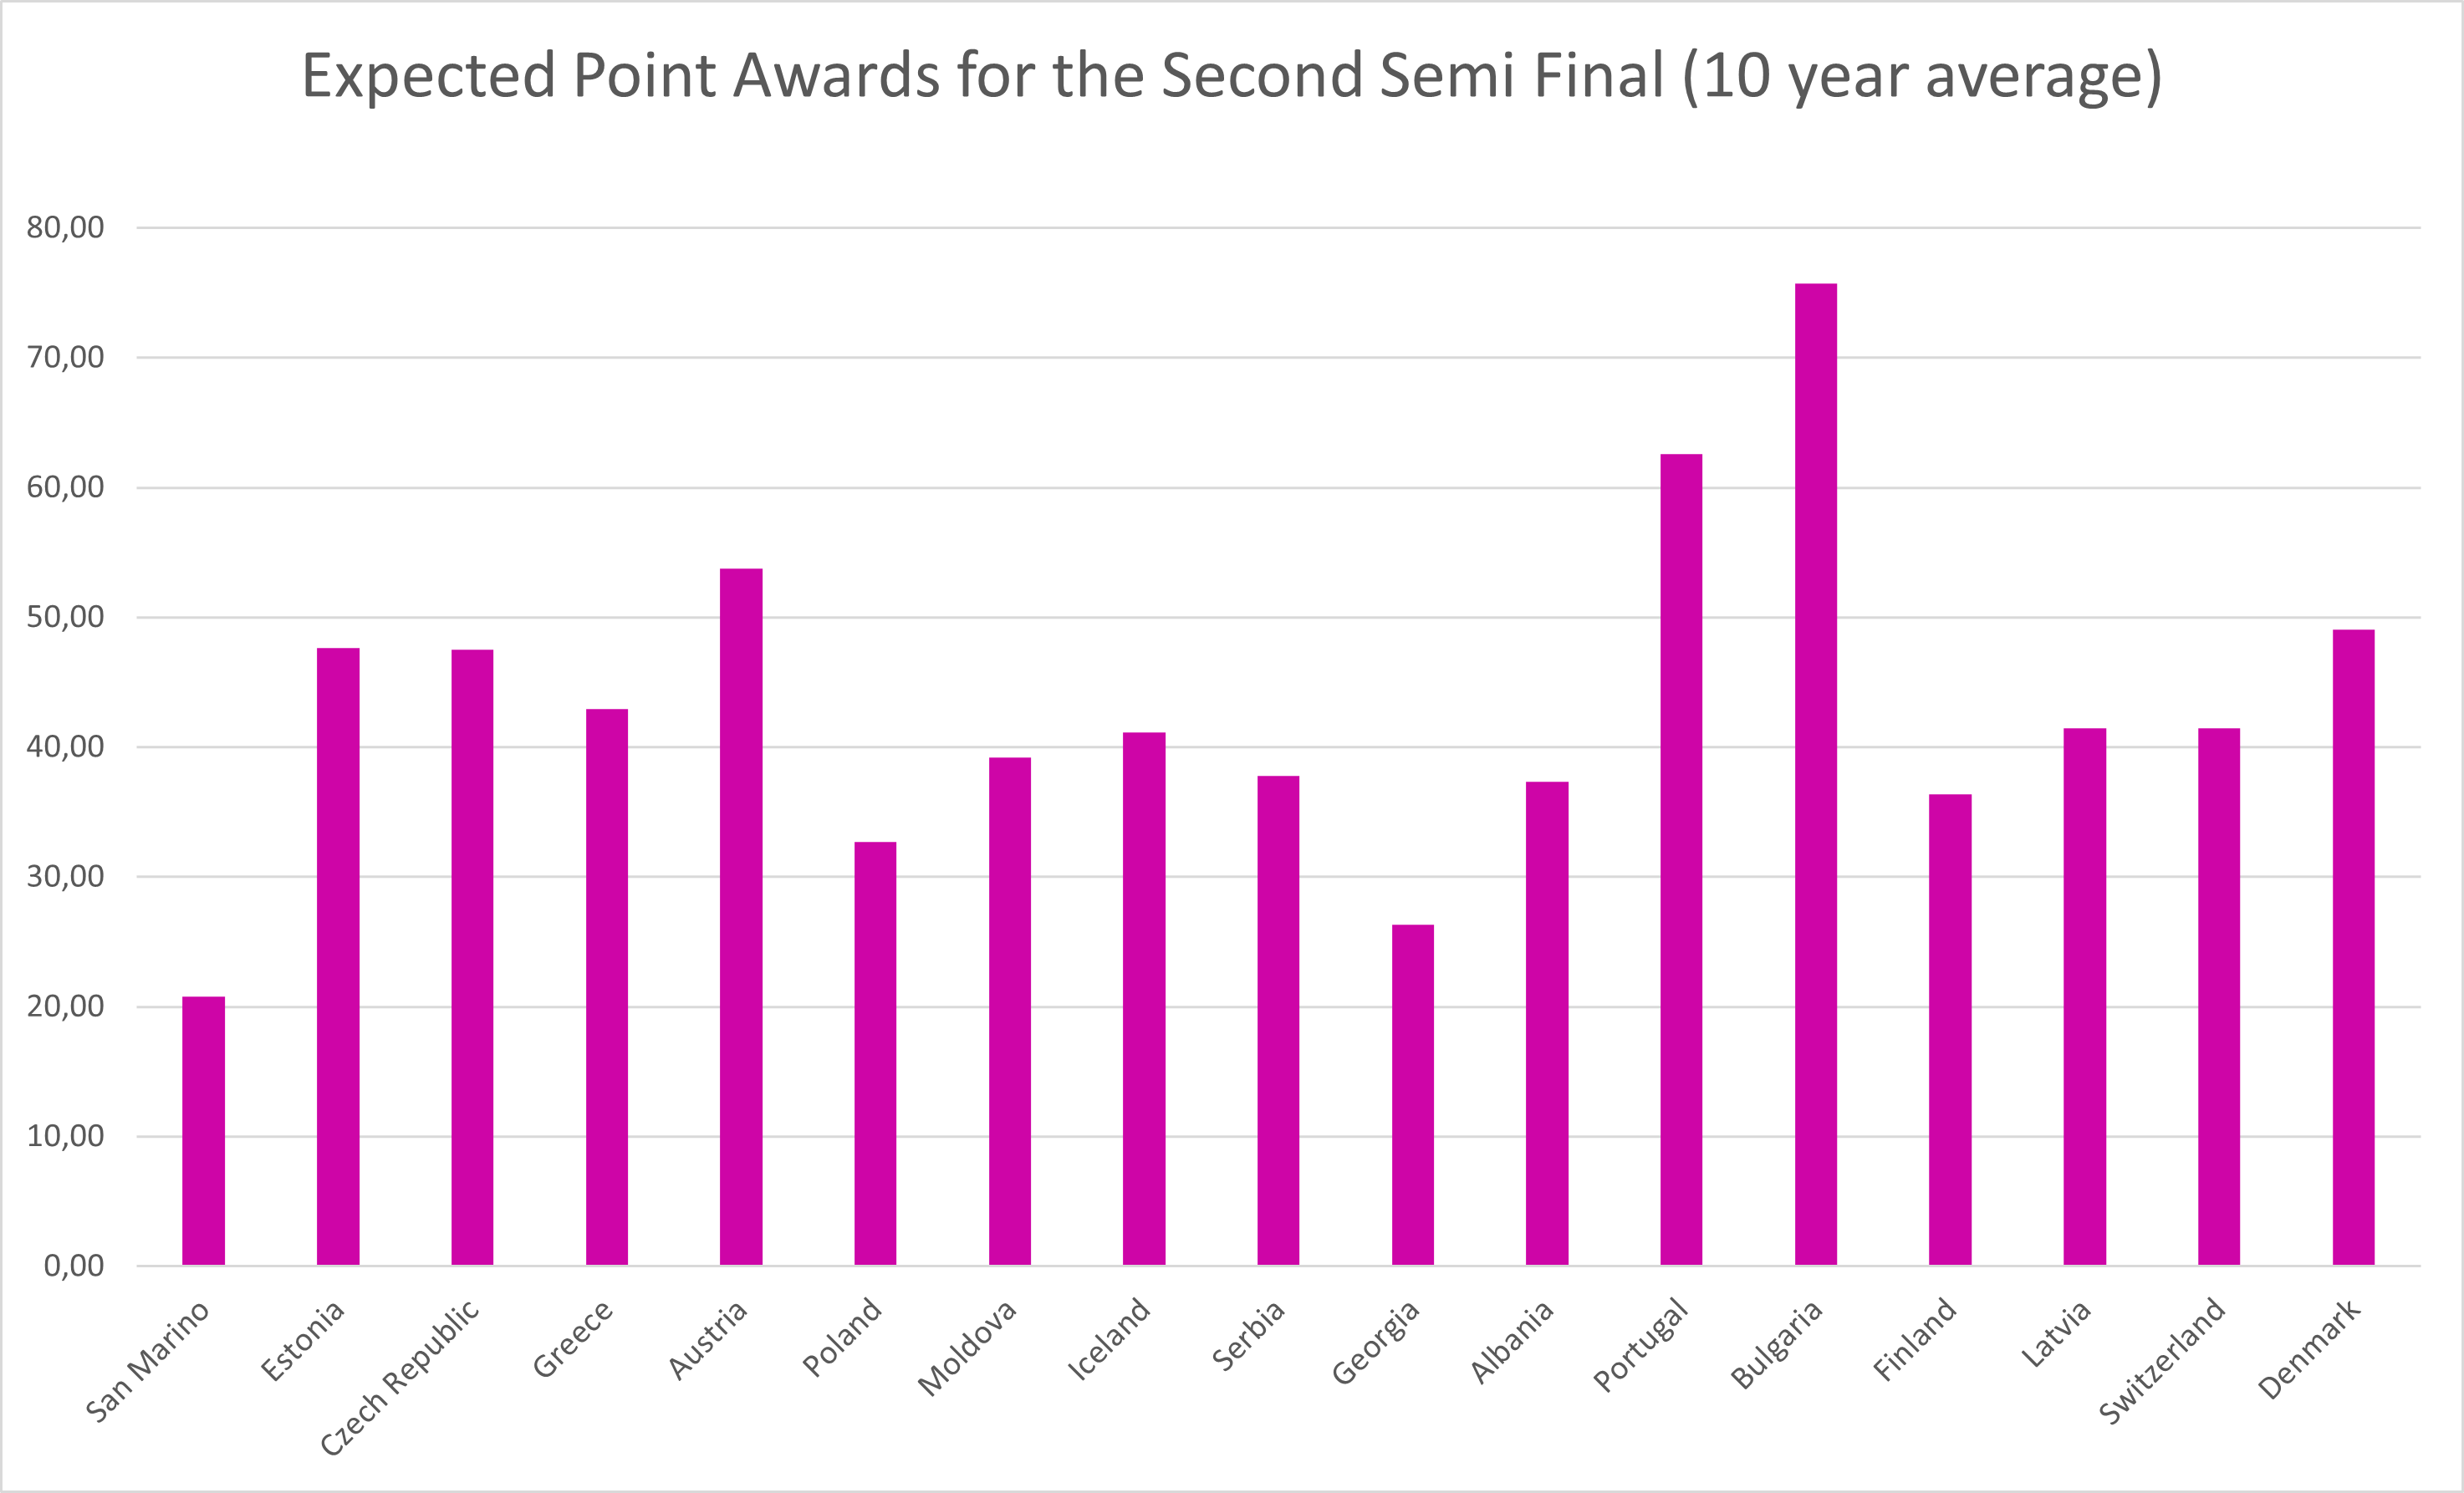
Let’s see. The 10 year window predicts the following result:
| Country | Expected Points |
|---|---|
| Bulgaria | 75.7 |
| Portugal | 62.6 |
| Austria | 53.8 |
| Denmark | 49.1 |
| Estonia | 47.6 |
| Czech Republic | 47.5 |
| Greece | 42.9 |
| Latvia | 41.4 |
| Switzerland | 41.4 |
| Iceland | 41.1 |
Again Bulgaria is in the top slot with a wide margin to Portugal in the runner up position. Denmark has lept from it’s non-qualifier 12th place to the 4th. Again an example of how having a Eurovision victory in the past can skew the data somewhat. But winning is the same as having the best song, and the best song is the one that gets awarded the most points overall. The fact that Denmark can swing from a 12th place to a 4th place if we widen the averaging window, more likely speaks to the somewhat spotty appeal of Denmark’s entries over the years than anything else.
| Country | R/O | Average 5 years | Average 10 years |
|---|---|---|---|
 | 1 | 0 | 0 |
 | 2 | 0 | 0 |
 | 3 | 0 | 0 |
 | 4 | 0 | 0 |
 | 5 | 0 | 0 |
 | 6 | 0 | 0 |
 | 7 | 0 | 0 |
 | 8 | 0 | 0 |
 | 9 | 0 | 0 |
 | 10 | 0 | 0 |
 | 11 | 0 | 0 |
 | 12 | 0 | 0 |
 | 13 | 0 | 0 |
 | 14 | 0 | 0 |
 | 15 | 0 | 0 |
 | 16 | 0 | 0 |
 | 17 | 0 | 0 |
| These countries may vote |
|---|
                    |


")
")
")
")
")