
As of today nobody has found a bullet proof formula to win the Eurovision Song Contest. The song, the performance and the staging are the most obvious success criteria, but we all know that this time of year another criterion is what we are all talking about – the running order. A starting position at the end of the event is thought to be a guaranteed qualification, while starting in the first half is held to be unfavorable.
You can read all the entries in the 2021 Statistics series here
The Numbers
But what do the numbers actually say? Looking at the success rate of starting positions is not so straight forward. From 2004 to 2007 the competition only had a single semi-final, which is skewing the data a bit. If we assume that starting in the last positions is favorable, then it matters for the statistics whether there were 26 or 18 entries. Further complicating matters is that there is a variable number of entries per year even after the dual semi finals were introduced.
The changes in the voting system in 2008 and 2009 have also biased the qualifications stats on some starting positions. For these 2 years only top 9 in the Tele Vote was guaranteed a spot in the Grand Final, while the last country to qualify was decided by the back-up juries.
In 2008, Sweden (R/O 2) qualified at the expense of FYR Macedonia (R/O 18) in the Second Semi-Final. In 2009 Finland (R/O 15) qualified at the expense of FYR Macedonia (R/O 13) in the First Semi-Final and Croatia (R/O 1) qualified at the expense of Serbia (R/O 4) in the Second Semi-Final. As a consequence starting in position 15 in the First Semi-Final and position 1 and 2 in the Second Semi-Final has benefited from an artificial boost in the statistics.
The First Semi-Final vs. The Second Semi-Final
Surprisingly there is a tremendous yet inexplicable difference between the success rate of a position, depending on whether it is in the First Semi-Final or the Second Semi-Final.
Below is a chart of starting positions and their respective success rate for semi-finals. The grey bars are the overall success rate for all semi-finals and the turquoise bars indicate the success rate of a position in the Second Semi-Final exclusively.
Position 2 in the running order is often called the “draw of death”. However the statistics of the semi-finals tell another story. In the Second Semi-Final position 3, 5, 9 and 10 all have lower qualification rates than position 2 and overall position 3 is the actual draw of death, while position 2 and 11 are tied for second worst at 43%.
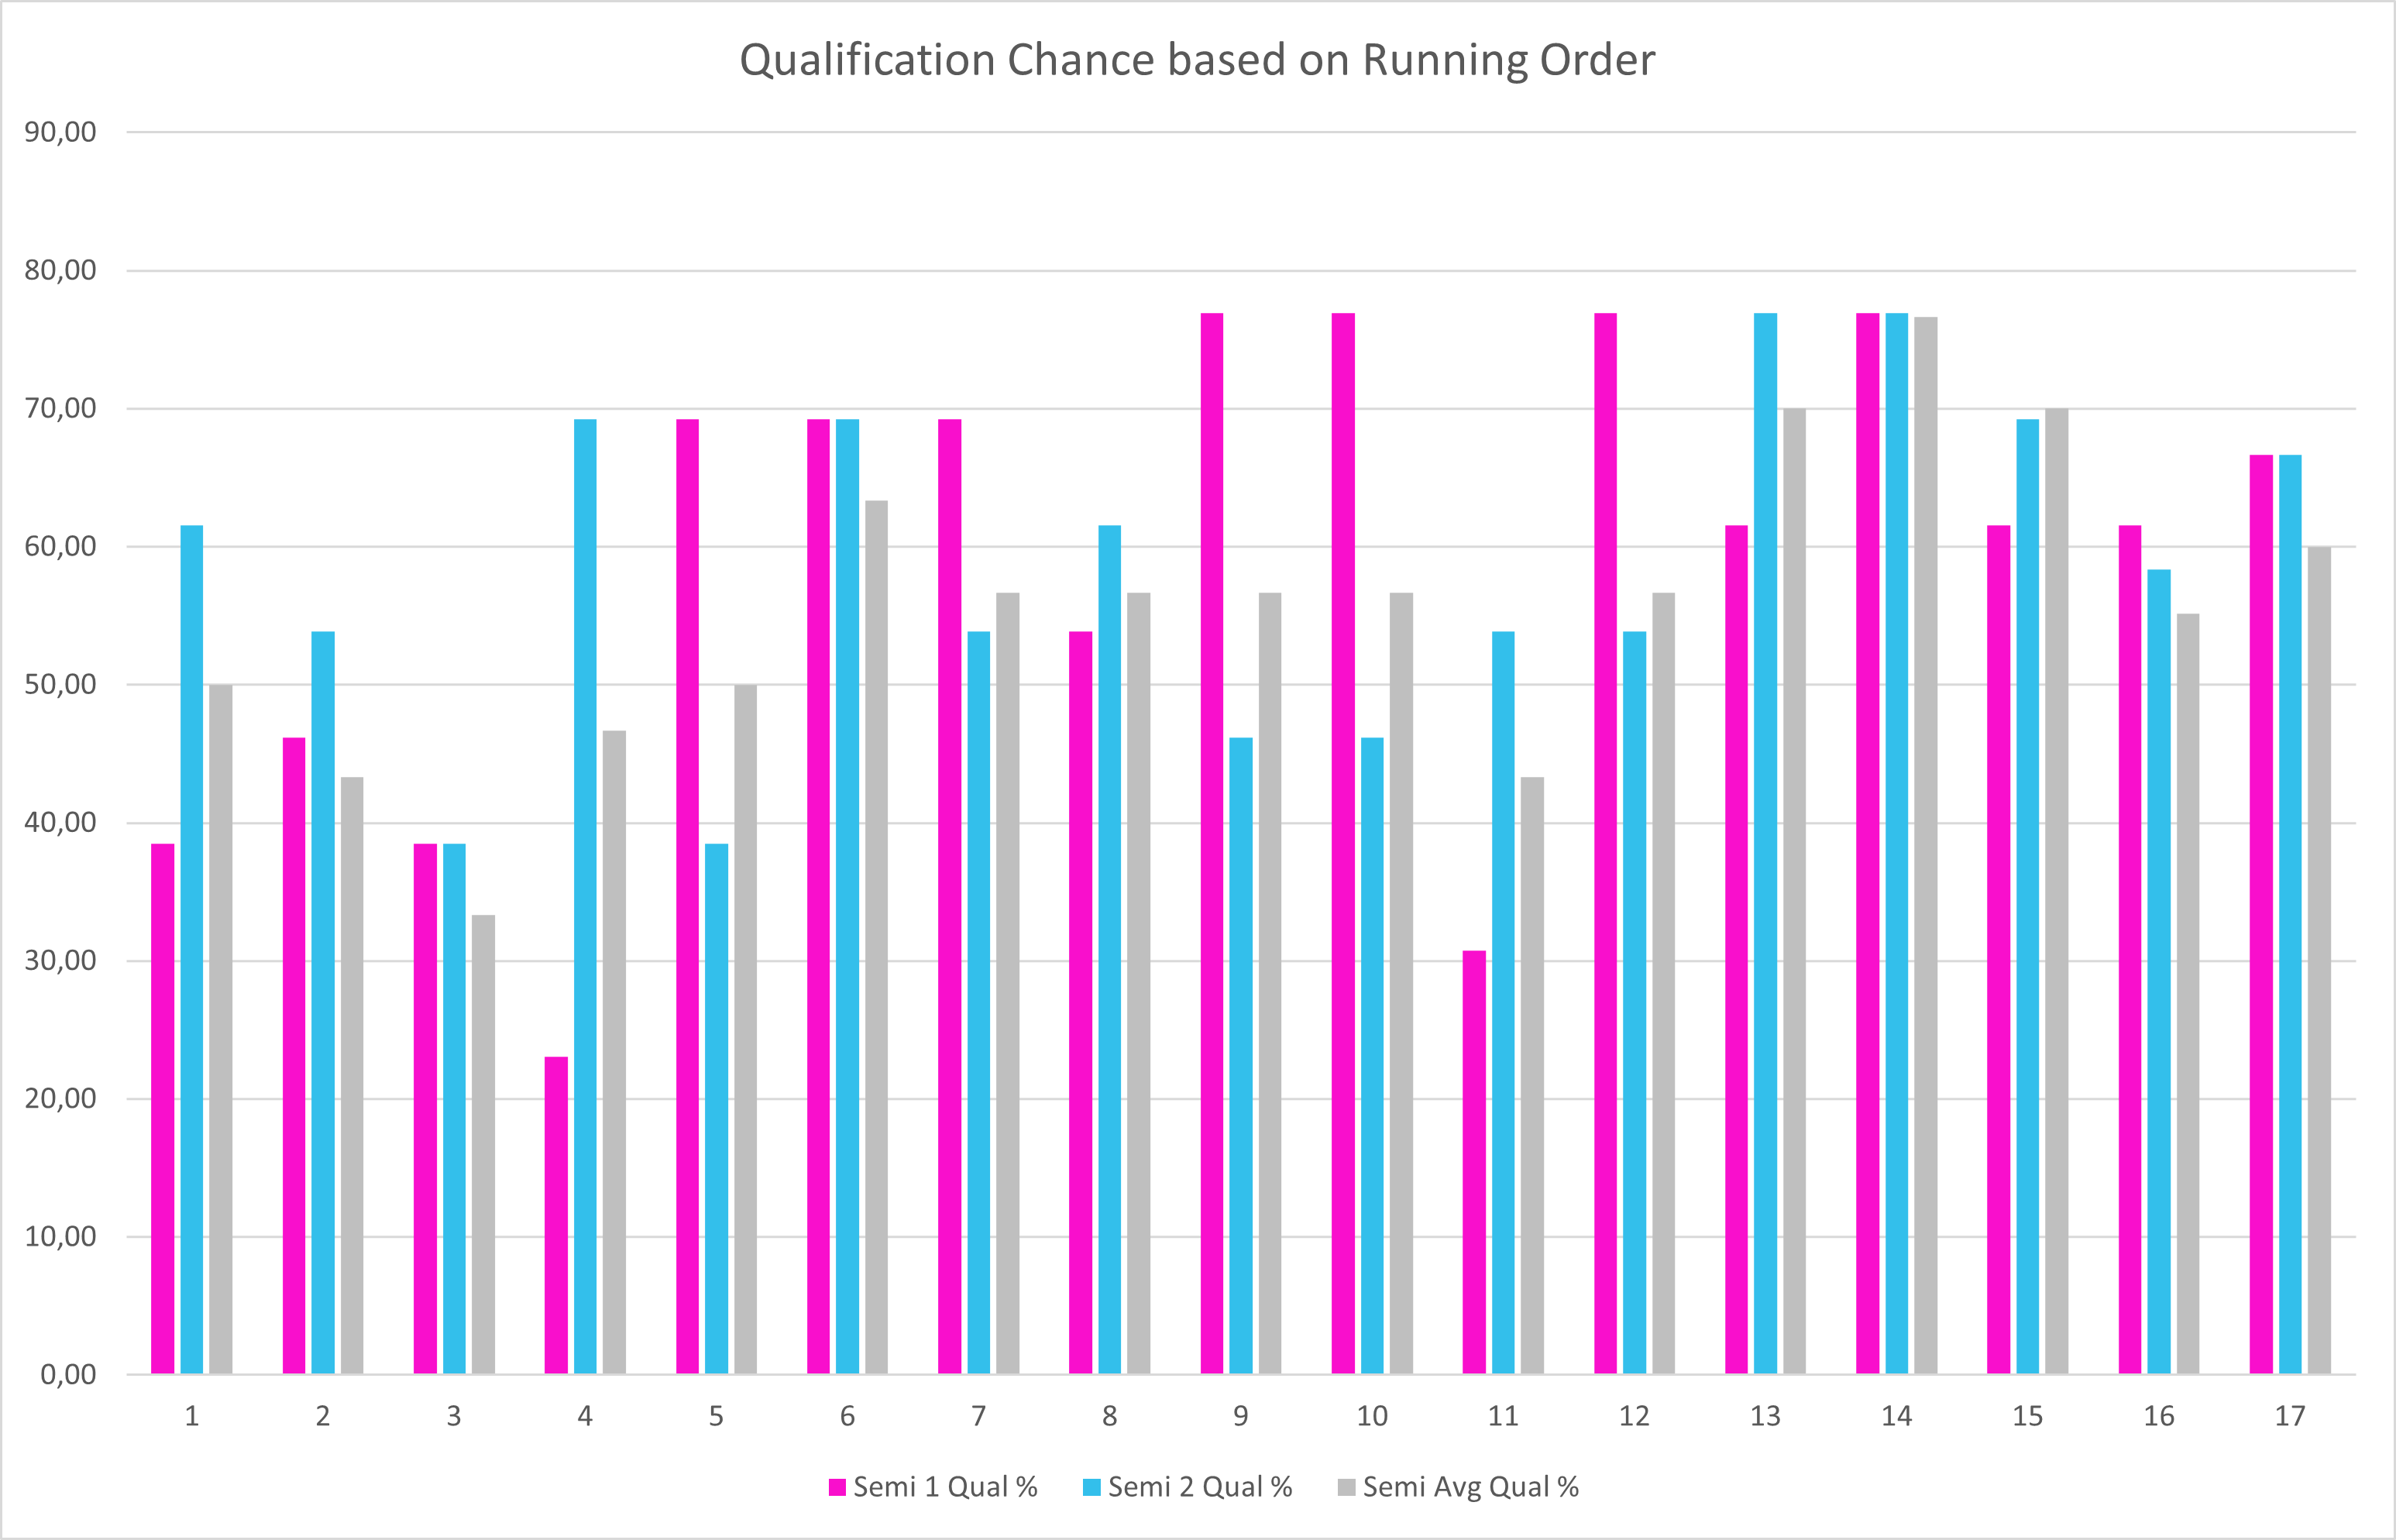
The biggest difference between the running order slots can be seen for slot 4. In the First Semi-Final slot four is the ultimate draw of death, while in the Second Semi-Final slot 4 is a pretty decent starting position for qualifcation chances. The worst slot for an entry is still in the first half, but is tied between slot 3 and 5. The best slots are spread almost evenly between the two halves, with the two very best slots, 13 and 14, both being in the second half.
It is worth noting that the data does not account for the effect of being last or second to last in the show. Slot 17, which Denmark happens to have been allocated, is the last in the Second Semi-Final in 2021, but that has not always been the case.
Again, if starting position were all that mattered we would be seeing 100% and 0% bars. It is curious that the qualification success rates are more equally distributed in the Second Semi-Final compared to the First Semi-Final. Maybe more people who vote watch the Second Semi-Final?
Predicted Qualifiers according to Running Order
Based on the historic success of each position, we can try to predict the qualifiers from the Second Semi-Final. In order of success chance, the qualifiers should be
| Country | Qualification Chance |
|---|---|
| Bulgaria | 76.9% |
| Finland | 76.9% |
| Latvia | 69.2% |
| Greece | 69.2% |
| Poland | 69.2% |
| Denmark | 66.7% |
| Iceland | 61.5% |
| San Marino | 61.5% |
| Switzerland | 58.3% |
| Portugal, Estonia, Moldova or Albania | 53.8% |
The 10th predicted finalist is tied between four nations, with a fairly large percentage-point gap down to Serbia with their 46.2% chance.
| Country | R/O | Overall % | Semi 2 % |
|---|---|---|---|
 | 1 | 50 % | 62 % |
 | 2 | 43 % | 54 % |
 | 3 | 33 % | 38 % |
 | 4 | 47 % | 69 % |
 | 5 | 50 % | 38 % |
 | 6 | 63 % | 69 % |
 | 7 | 57 % | 54 % |
 | 8 | 57 % | 62 % |
 | 9 | 57 % | 46 % |
 | 10 | 57 % | 46 % |
 | 11 | 43 % | 54 % |
 | 12 | 57 % | 54 % |
 | 13 | 70 % | 77 % |
 | 14 | 77 % | 77 % |
 | 15 | 70 % | 69 % |
 | 16 | 55 % | 58 % |
 | 17 | 60 % | 67 % |
| These countries may vote |
|---|
                    |


")
")
")
")
")